Pivot Point Calculator is a Forex calculator that calculates support and resistance levels based on the previous data for a certain time frame.
That means if you are using a daily time frame the pivot point calculator takes yesterday’s data like open, close, high and low price and calculates the support and resistance levels.
In this article you will see what a pivot point calculator is and how it calculates the levels which are used as support and resistance levels.
You can use this pivot point calculator to help you draw support and resistance levels on the chart or you can use it as an additional confirmation to the support and resistance levels you have drawn already.
Contents
Pivot Point Calculator
Pivot point calculator requires open, close, high and low price to calculate the pivot points.
This pivot point calculator have four different pivot points that can be calculated:
- Standard
- Woodie
- Camarilla
- DeMark
Only DeMark requires 4 prices, open price as a additional one compared to other three pivot points calculators that requires only three prices:
- Close price
- High price
- Low price
Here are the formulas used to calculate the pivot points for each of these calculators.
How Do You Calculate Pivot Points?
Here are the formulas used for:
- Standard
- Woodie
- Camarilla
- DeMark
pivot point calculators.
Standard Pivot Point Calculator
Here are variables used in the formula:
- P = Pivot
- Rx = Resistance
- Sx = Support
- H = High price
- L = Low price
- C = Close price
P = (H + L + C) / 3
R1 = (2 x P) – L
R2 = P + H – L
R3 = H + 2 x (P – L)
S1 = (2 x P) – H
S2 = P – H + L
S3 = L – 2 x (H – P)
The pivot point is interpreted as the primary support/resistance level. Pivot line is the point at which the main trend is determined.
From first to a third level resistance and support points serve as additional indicators of possible trend reversal or trend continuation.
Woodie Pivot Point Calculator in Forex
Here are variables used in Woodie pivot point calculation:
- P = Pivot
- Rx = Resistance
- Sx = Support
- H = High price
- L = Low price
- C = Close price
P = (H + L + 2 x C) / 4
R1 = (2 x P) – L
R2 = P + H – L
S1 = (2 x P) – H
S2 = P – H + L
Woodie’s pivot points are similar to standard pivot point calculators. The difference is in that more weight is given to the Close price of the previous period.
Camarilla Pivot Point Calculator in Forex
Here are variables used in Camarilla pivot point calculation:
- Rx = Resistance
- Sx = Support
- H = High price
- L = Low price
- C = Close price
R4 = (H – L) x 1.1 / 2 + C
R3 = (H – L) x 1.1 / 4 + C
R2 = (H – L) x 1.1 / 6 + C
R1 = (H – L) x 1.1 / 12 + C
S1 = C – (H – L) x 1.1 / 12
S2 = C – (H – L) x 1.1 / 6
S3 = C – (H – L) x 1.1 / 4
S4 = C – (H – L) x 1.1 / 2
In Camarilla pivot point calculator there is no Pivot line calculated like in case of Standard pivot point and Woodie calculator.
Camarilla pivot points are a set of eight very probable levels which presents support and resistance levels for a current trend.
DeMarkPivot Point Calculator in Forex
Here are variables used in DeMark pivot point calculation:
- Rx = Resistance
- Sx = Support
- H = High price
- L = Low price
- C = Close price
- Open = Open price
If Close < Open: X = H + (2 x L) + C
If Close > Open: X = (2 x H) + L + C
If Close = Open: X = H + L + (2 x C)
R1 = (X / 2) – L
S1 = (X / 2) – H
Tom DeMark’s pivot points are not pivot points exactly, but are the predicted lows and highs of the period.
How to Use a Pivot Point Calculator?
Use pivot point calculator by following these steps:
- select time frame you want to trade
- for example daily time frame D1
- Find last closed candle
- close candle means the candle that is one candle before the current one that is active
- Read four prices:
- Open price
- Close price
- High price
- Low price
- Enter these four values into the calculator and click Calculate
With these four steps you can calculate pivot point levels for each of the four pivot point calculators in Forex.
Use Pivot Point Calculator On Daily Time Frame
Let’s make an example with a daily time frame and calculate pivot point levels.
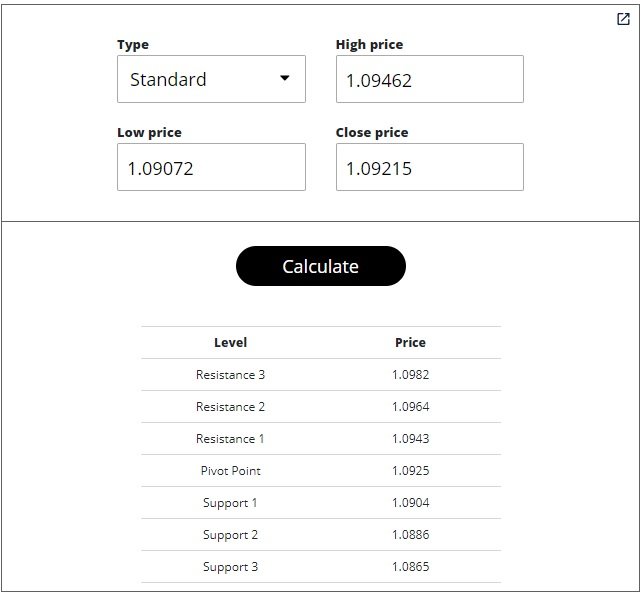
Here is yesterday candle with four prices:
- Open = 1.09399
- High = 1.09462
- Low = 1.09072
- Close = 1.09215

With these four prices you can use a pivot point calculator in Forex to calculate pivot levels. Below is calculation for standard pivot point levels.
You select which pivot point calculator type you want to use and enter prices that are required.
For standard pivot point calculators you need high price, low price and close price.

For a Woodie calculator you need high price, low price and close price. When clicked Calculate you get pivot point and support and resistance levels.

Camarilla pivot point calculation requires high price, low price and close price. When clicked Calculate you get support and resistance levels.

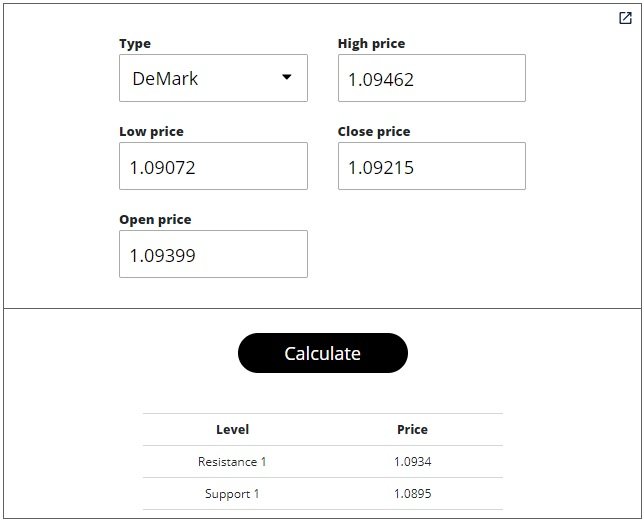
DeMark levels are support and resistance levels. Only one level you get when you enter all four prices levels for a daily time frame candle.

How to Calculate Weekly Pivot Points?
To calculate weekly pivot points you need weekly candle:
- Open price
- High price
- Low price
- Close price
With these weekly prices you enter them into the pivot point calculator and you get pivot level and support and resistance levels.
Here is an example of a weekly candle with four prices.

How to Calculate Pivot Points in Day Trading
In day trading you calculate pivot points by entering H1 or one hour time frame candle details like OHLC prices.
OHLC is for Open, High, Low and Close price.
Day trading represents trading on smaller time frames that are inside one day. One day has 24 H1 candles which is enough to calculate pivot points.
Conclusion
Pivot point calculator in Forex gives you four pivot point calculators:
- Standard
- Woodie
- Camarilla
- DeMark
For each of them you need Open, Low, High and Close price to calculate pivot level and support and resistance level.
If you are beginner in Forex trading these levels can help you define where the support and resistance levels are on the chart.

0 Comments