I want to give more insight with AUD/USD Forex currency pair analysis through following topics:
- AUD/USD Name Analysis
- AUD/USD Analysis Popularity
- How to Trade AUD/USD
- Trading Session Pip Range
- What is AUD/USD Daily Range
- AUD/USD Weekly Range
- Monthly Range and Pip Range History
- What Impacts AUD/USD Volatility
- Connection Between Volatility and News
- AUD/USD Analysis – What to Take From Here
Contents
- 1 AUD/USD Name Analysis
- 2 AUD/USD Analysis Popularity
- 3 How to Trade AUD/USD
- 4 AUD/USD Analysis – Trading Session Pip Range
- 5 AUD/USD Analysis – Daily Range
- 6 AUD/USD Analysis – Weekly Range
- 7 AUD/USD Analysis – Monthly Range and Pip Range History
- 8 What Impacts AUD/USD Volatility
- 9 Connection Between Volatility and News
- 10 AUD/USD Analysis – What to Take From Here
AUD/USD Name Analysis
Australian dollar, AUD, and U.S. dollar, USD, are the currencies in this pair. Unique Australian impact have made this pair called “Aussie” among the traders.
While U.S. dollar is already used in other trading pairs, to specify combination of AUD and USD currenies traders have used Australian country as a base for the nickname, Aussie.
AUD/USD Analysis Popularity
The AUD/USD currency pair is ranked as the sixth highest pair for trading in the world, with around 7% of all worldwide currency trades annually. The Australian dollar, AUD, is the 5th most traded currency in the world by the information from the International Bank of Settlements.
The AUD is dependent on the commodities price and its price fluctuate as the price of the commodities. While Australia and U.S. are among the largest exporters of the gold the two currencies are very popular for traders because the gold is commodity which the traders like to trade. When the price of the gold fluctuate, the price of these two pairs also fluctuate.
Both currencies, AUD and USD, are major currency pairs in the trading world.
How to Trade AUD/USD
While the AUD/USD trading pair is dependent on the gold movement you can watch when the gold price change. The AUD price will move in the same direction like the gold price and USD will move in the opposite direction.
If you want to get the money out of the Forex market by trading AUD/USD trading pair watch out on the gold price change. When the price of the gold rises you can expect that the AUD/USD pair will move also up. If the price of the gold falls down you can expect that the price of the AUD/USD trading pair will move down.
How to Trade AUD/USD – Volatility
The pair is relatively volatile and traders like to trade it because they can implement their strategies. It is not to slow but it is not to fast in terms of pip range volatility.
The AUD/USD pair volatility is dependent on the central banks interventions, especially when the interest rates change. For the U.S., FED, and for the Australia, RBA(Reserve Bank of Australia), the central banks influence on the pair volatility. When the interest rate changes the pair will move for sure and traders are waiting ready for that kind of movement.
While the interest rates in the Australia are among the highest is it not uncommon that the investors tend to invest more money in the Australian economy just to extract as much is possible from the interest rates.
AUD/USD Analysis – Trading Session Pip Range
Lets dive into AUD/USD trading pair analysis to see how the pair behaves in different hour, day and month. I want to emphasize that the time of the candle price is taken out from the platform which is on GMT+1.
First chart shows how the pair is doing on the trading sessions compared to other trading pairs. I have ordered pairs on the chart to easily see which pair have the lowest and which have the highest volatility.
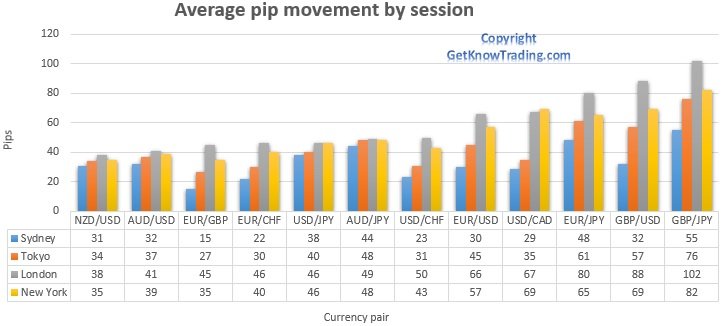
Trading session pip range – comparison
The AUD/USD is the 11th trading pair with the low volatility in London and New York trading session and low volatility in Asian session, which implies that the pair is the one of the low volatile pairs among all other pairs. The AUD/USD analysis shows us that traders do not love to much to trade it and we have low pip range during each session.
Read more: Forex Market Trading Session
Which Trading Session Should You Trade
If you are not bond to the time frame during each day like if you live in Australia, and it does not make a problem for you to trade on the London or New York trading session, then you can extract the best volatility from the market.
On Sydney and Tokyo session you will have some volatility which can be enough for almost every strategy because pip range more around 30 pips is great. Moving from Asian session to European, London, session we see rise in the pair volatility.
The London session gives us volatility which is double compared to the Sydney session on some days in a week. Because the USD and AUD are world major currencies, many traders love to trade these currencies and consequently pair have higher volatility.
During the London session we have overlap with New York session which gives us more volatility because U.S. traders jumps in the market. During overlap, news on the U.S. market are published which impacts all currencies in the world.
You will see further in this post how the overlap time have impact on the pair volatility during the day.

From this chart you should take information that the AUD/USD analysis shows you that:
- pair have high volatility on the London and New York trading session
- during overlap with London and New York session, the trading pair have small increase in volatility
- starting from the Monday, volatility increases
- volatility peak is in the middle of the week, on Wednesday
- volatility is still high on the Friday
AUD/USD Analysis – Daily Range
If you take a look how the overlap looks like then you understand why pip range is higher on these times. The trading session chart shows that the time between 2 trading session, the London and New York, happens between 14:00-18:00h(GMT+1).
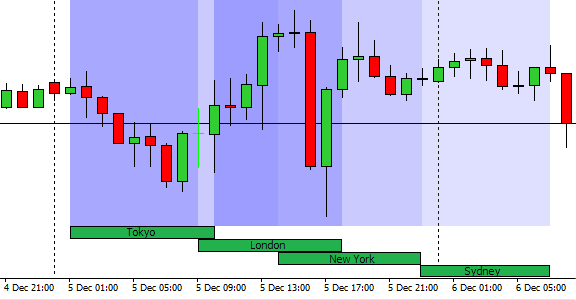
How does the time overlap looks on the daily pip range, measured in hours during a day is shown on the next chart. Immediately you can see that time between 14:00-18:00 have rise in pip range which confirms above said.
Time overlap between the London and New York trading session, news publishing, large amount of traders on the market have a result as increased pip volatility in that time.
It is not only the London and New York trading session overlap that makes a difference in pip volatility. You can see that the trading session overlap between the London and Tokyo make a change on the pair volatility.

AUD/USD Analysis – London Session
The London session is known as the largest one and while the USD and AUD are major currencies, traders like to trade them. We see increase in pip range from 09:00h up to 11:00/12:00h.
Around noon we see drop in the pip range on the London session. Mostly this is due to lunch brake in Europe, positions are set and traders relax in the next 2 hours waiting for the New York session.
AUD/USD Analysis – New York Trading Session
Around 14:00h we see rise on the pip range and reason for this is that U.S. traders together with the Europe traders are active on the market. The AUD/USD volatility increases due to large amount of trades.
Traders form their positions and mostly around that time news from the U.S. are published. News have high impact on this pair because the USD currency is widely connected to all other currencies. So, when the USD currency moves all other currencies also move, more or less.
Going to the end of the day you see that the pip range starts to decline, especially when the London trading session finishes (17:00h). Large amount of traders close their position, AUD/USD volatility declines and pair is traded less.
By the end of the day the pip range is at the same level as it was on the start of the day. Sydney and Tokyo trading session takes over and another day comes. One thing that is visible on the trading session chart is that the pair have almost same volatility during Sydney and Tokyo overlap. That means that the pair is available to trade with good pip range volatility in each trading session.
That is something we cannot see on the Forex market where most pairs have slow volatility during Asian sessions.
What you should take from these two charts for your trading:
- During a day the pair have highest volatility on the trading session overlap
- Three trading session overlap have increase in the the pair volatility, Sydney-Tokyo, Tokyo-London and the London-New York session
- The best time to trade is on the London-New York trading session overlap where the pip volatility is at the highest rate
- You should close your positions, if you are a day trader, until the London session closes to avoid later “slower” movements
AUD/USD Analysis – Weekly Range
On the next chart I will show you how the pair is doing on the weekly basis, but not on the trading sessions. This information you can incorporate into your trading strategy when you plan to trade this pair.
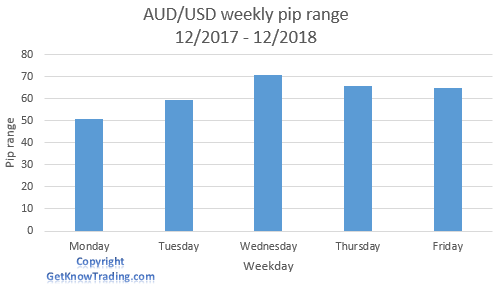
Similar to the chart “AUD/USD analysis – trading session pip range” this chart shows similar data on the pair volatility. Starting from the Monday, the pip volatility increases. This increase we can connect with waking of the market after the weekend.
From the Monday to Wednesday, traders makes they trading strategy and enters into trades. Trends on the pair movement start to form. Traders looks what is pair trend, make trading plan when to enter and exit and which news will have impact on the trading pair.
These key characteristics are done over weekend before or on the start of the week. When all is done traders enters into positions and they day trade or wait several days to exit their positions.
When the pair hits Wednesday, mostly traders start to plan to exit trades. The pair volatility declines to the end of the week. On the Friday there is still volatility, higher comparing to the Monday.
On the Friday traders tend to close their positions due to weekend on which sometimes can news be published, which have high impact on the pair. So, to avoid that kind of possible problem, if news are against trader, they close their position on Friday.
Friday – Day for Profit Lock
During the Friday you could see that the price of the pair reverse against weekly trend. Reason for this is also in closing positions of the traders who takes their profit from the market.
What you should take from this chart:
- On the Monday prepare yourself for trend forming
- Until the Wednesday do not trade or scalp if you are scalper or day trader. Wait until highest volatility hits the pair where you can extract most out of this trading pair
- If you are weekly or long term trader wait until the Wednesday until the trend is formed or confirmed
- On the Friday get out from the trading pair if you are uncertain will there be any news over the weekend which could impact the trading pair volatility
AUD/USD Analysis – Monthly Range and Pip Range History
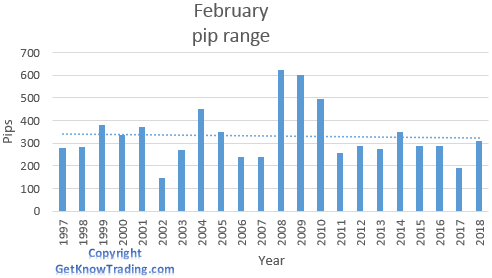
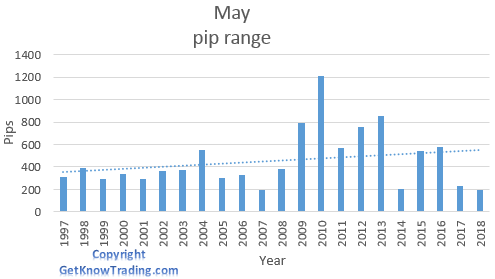
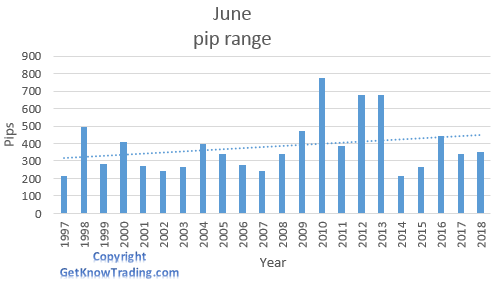
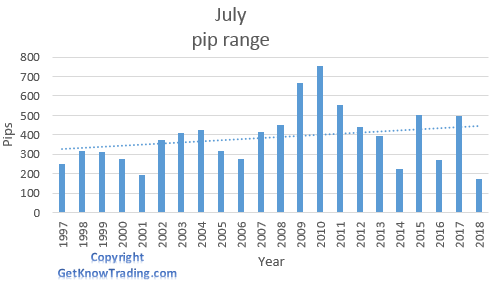
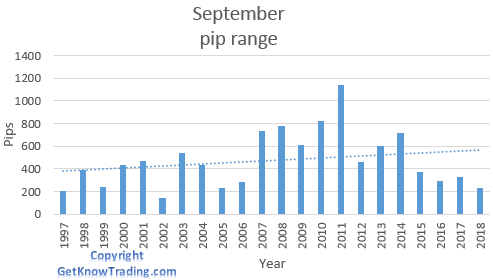
In the next part of the blog post I will show you 12, twelve, charts which shows the AUD/USD analysis over few decades in order to give you the best pair volatility overview.

January

February
March

April

May
June
July
August

September
October

November

December
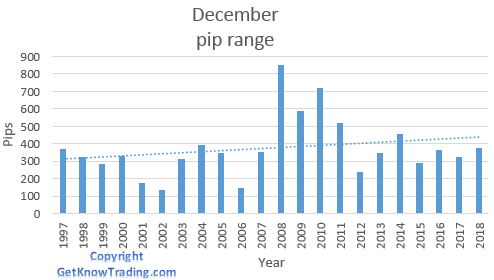
AUD/USD Analysis – Monthly Conclusion
Small volatility leaves smaller opportunity for traders because it is much easier to grab some pips in over 100 daily pip range instead trading on 70 daily pip range. So, in these times you can expect that you will have lower average pip income.
This directly impact on the trading results because smaller pip movement can be hard to trade when spread or commission is to large. Sometimes opening a trade is not worth of the costs you will pay just to enter into the trade.
Smaller volatility can trick you in a way you think there is a trend but momentum slows down and you get stuck in a trade. You have less trades available or signals from your trading strategy and your strategy begins to give you less profitable trades.
What we see generally by average line on each month is that the average pip range is rising from 2009 and we have higher volatility than before. This gives us more opportunities to catch higher number of pips but still pair has large enough volatility that allows us to trade it and to earn money.
What Impacts AUD/USD Volatility
What influences these two currencies is primary their economy. One of the highest indicator that have large impact on the currency is interest rate in each country.
Mostly when interest rates are increasing price of the currency is increasing. This is called International Fisher effect.When interest rate is higher in Australia it means that AUD will rise comparing to USD. When USD interest rates is higher than Australia, USD will rise comparing to AUD.
Higher interest rates means currency
will attract more investors in that country where they can earn more money and
currency becomes more desirable.
Connection Between Volatility and News
Countries with high level of inflation depreciate more compared to other currencies. Inflation causes the central bank to intervene in a way as adjusting interest rate to control undesired effects.
When interest rates is increasing that is good for currency so you can expect price of AUD will rise. Why does it rise – because when there is high interest rate in country it attracts more investors who can benefit on high rates.
But have in mind that the trading pair chart is not only with one currency but with two currencies. This means sometimes if interest rates is increasing for AUD it could happen that trading pair value will not increase. Reason could be that USD is stronger even interest rate on AUD is rising, pair price could remain moving sideways or even falling.
PPI, CPI, PMI and GDP
Indicators:
- PPI as Producer’s Price Index
- shows trends within sale markets, manufacturing industries and commodities markets
- CPI as Consumer Price Index
- Consumer Price Index measures inflation that is most important indicator of the economic health of that country
- PMI as Purchasing Managers Index
- shows us are purchasing managers optimistic or pessimistic about the economy
- GDP Gross Domestic Product
- tells us how much the economy is strong, hod does it advance and is it healthy or not
These indicators have impact on the price of any currency and they are ones which you should watch. Price index is telling how the price of consumer goods and manufacturing material is doing. These prices have impact on inflation and consequently on interest rates.
GDP is overall information how country is doing and this information will have large impact on the price of currency.
I will not go more into details about these indicators but you can check for more information on the links I have gave.
AUD/USD Analysis – What to Take From Here
As I have give a lot of information in AUD/USD analysis there is useful information you can use in your trading.
- Pair have low volatility and moderate movements
- Use overlap in trading sessions, Sydney and Tokyo, London and New York, to extract as much pips is possible because then you will have the highest movement
- During a week choose to trade on the middle of the week, Wednesday and Thursday because then you have the best volatility and chance to grab pips from the market
- Watch for Friday – lock the profits you have to avoid impact from weekend news if there is any
- Watch out on published news and indicators that have large impact on the currency
Read more:
- EUR/USD Volatility – Pip Range Analysis
- GBP/JPY Pip Range Analysis – Account Widow Maker
- GBP/USD Pip Range Analysis – Cable Connection
- EUR/GBP Pip Range Analysis – Forex Under the See Level
- EUR/JPY Pip Range Analysis – Euro Japan Samurai
- EUR/CHF Analysis-The Biggest Crash in the Forex History
- USD/CAD Pip Range Analysis – Oil UP Pair DOWN
- USD/JPY Pip Range Analysis – Ninja Pair
- USD/CHF Pip Range Analysis – Swissie
- AUD/JPY Pip Range Analysis
- NZD/USD Pip Range Analysis
- What is Meaning of XAU in Forex
- What is Meaning of CFD in Forex
- What is GU in Forex
- What is GJ in Forex

0 Comments