
- Catchy name, under the see – why it is called like that?
- We have two largest currencies in Europe. Does it mean that pair have highest volatility and it is traded at most on the Forex market?
- Do traders love this pair?
- If they are the largest currencies in Europe it means that they are influenced by news?
- Chunnel, Chunnel – is it Channel or something else? 🙂
I want to give more insight with EUR/GBP Forex currency pair analysis through following topics:
- EUR/GBP Name Analysis
- EUR/GBP Analysis Popularity
- How to Trade EUR/GBP
- Trading Session Pip Range
- What is EUR/GBP Daily Range
- EUR/GBP Weekly Range
- Monthly Range and Pip Range History
- What Impacts EUR/GBP Volatility
- Connection Between Volatility and News
- EUR/GBP Analysis – What to Take From Here
Contents
- 1 EUR/GBP Name Analysis
- 2 EUR/GBP Analysis Popularity
- 3 How to Trade EUR/GBP
- 4 EUR/GBP Analysis – Trading Session Pip Range
- 5 EUR/GBP Analysis – Daily Range
- 6 EUR/GBP Analysis – Weekly Range
- 7 EUR/GBP Analysis – Monthly Range and Pip Range History
- 8 What Impacts EUR/GBP Volatility
- 9 Connection Between Volatility and News
- 10 EUR/GBP Analysis – What to Take From Here
EUR/GBP Name Analysis
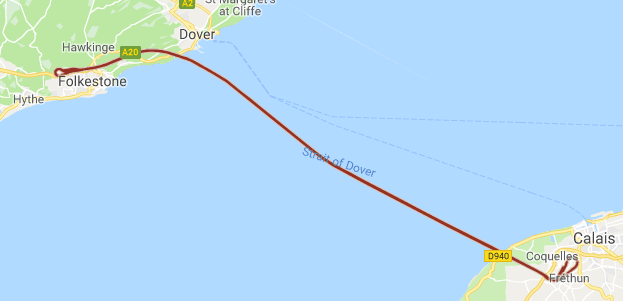
EUR/GBP have a nickname “Chunnel”. Nickname Chunnel is defined by the Channel Tunnel that connects United Kingdom and France. It is tunnel under the see that connects UK and Europe.
Translated to currency term, connects Eurozone Euro and United Kingdom Pound.
EUR/GBP Analysis Popularity
EUR/GBP pair is known among traders due to its relatively low volatility and traded volume. Both currencies are major currency and this characteristic give pair more credibility where on some broker platform you can have small spread for trading.
Pair is cross pair because it does not contain USD currency but it is traded in high volume. It is eight most traded currency pair. It is known by its trending activity.
Read more: What is Major, Minor and Cross Trading Pair
How to Trade EUR/GBP
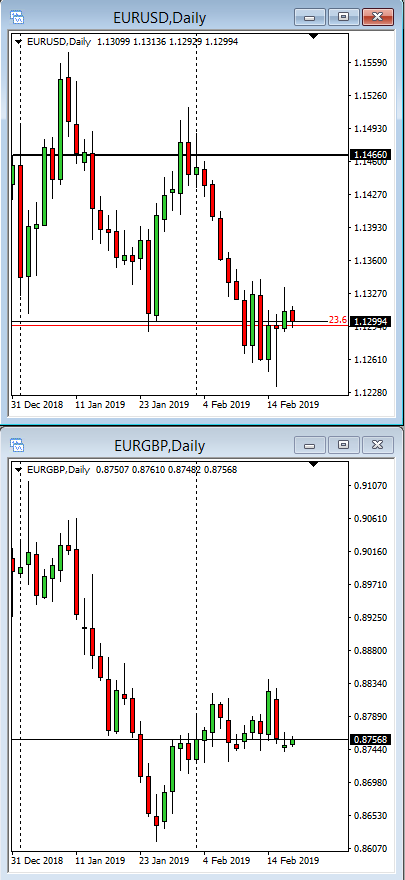
Because both currencies are European currency, trading pair is close connected to EUR/USD trading pair. So when EUR/USD moves, on bigger time frames, you can see correlation with EUR/GBP pair. You can expect EUR/GBP will rarely rise up when EUR/USD is moving down.
On the picture below you can see when EUR/USD was falling down, EUR/GBP was following. When EUR/USD is rising, EUR/GBP is following. EUR/GBP pair does not move in same pip range like EUR/USD, but direction of the movement is similar.
GBP tends to form trend for the rest of the day in first hour of London trading session. If current price of GBP, since Midnight, is above yesterday price, but not to far from it, then you can expect that price will go up. In case of lower price compared to yesterday, plan to open a trade with sell order.
When GBP moves it moves very quickly and it makes spikes on those movements. But trend of those spikes does not last to long and currency tends to slow down and move sideways.
How to Trade EUR/GBP – Volatility
Pair is available to trade 24/7 from Monday to Friday, but mostly traders are active from 09:00 to 16:00 GMT time. During this time period, pair is mostly volatile and traders are in the market.
GBP is not liquid as EUR or USD but it moves enough to make profit. Pair can move very fast and change moving direction very fast specially during news published. When it moves fast in one direction you can expect it will slow down very soon because of lack of volatility which cannot sustain that move for to long.
When trading GBP watch out to set wide stop loss to avoid spikes and fast movement which form a breakout. Trend lines tend to have breakouts and watch them when setting stop loss to close to them.
EUR/GBP Analysis – Trading Session Pip Range
Lets see how trading pair is standing against all others pairs I have covered in the research.
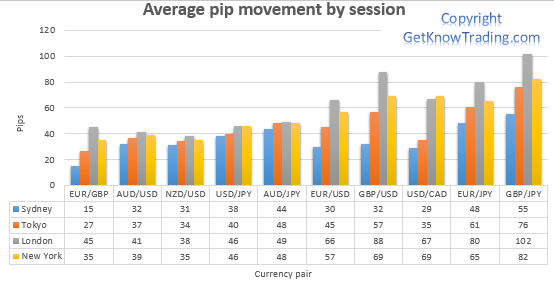
Chart under this text shows us a list of trading pairs and their position between them compared by pip range during each trading session.
To learn which sessions exist, please visit next link and get familiar with them so you can easily follow next section of post.
Read more: Forex Market Trading Session
Lets continue.
EUR/GBP pair is, as you can see, on the first place on the left side of the chart. This place is the worst one by pip range, volatility, compared to all others pairs. Pip range does not reach 50 pips on the best trading session.
The only trading session that gets a little bit more volatility compared with next two pairs, AUD/USD and NZD/USD, is London. This makes sense because EUR and GBP are European currency and most traders trade them.
Usually traders like to trade their own currency. One of the reasons for this decision is that traders live in the countries where currency is spent and thus it is easier to understand fundamental analysis. With fundamental analysis they make their strategy when to open a trade.
Chart tells what is average pip range for this pair but it does not say how much is pip range during each day in a week by each session. That information would be helpful because you trade each day and it would be great to have better insight. For this please continue reading because next chart gives more information.
EUR/GBP Overview per Day in a Week
Starting from Monday pair starts with around average 30 pip range. The best trading session is London when most traders trade these two currencies.
Going to middle of the week, Wednesday, EUR/GBP have increase in pip range in each trading sessions except Sidney where volatility does not increase, it even slows down. It means that traders in that time zone do not trade these currencies.
On Thursday, during London and New York, EUR/GBP have the highest volatility and pip range is at maximum. Traders have their position already open and they follow trend on the pair. Middle of the week is very volatile because traders have their strategy confirmed, they know trend heading and they close or open positions. While these conditions are met traders activity is on maximum and thus volatility on EUR/GBP pair is at the maximum.
On Friday, compared with Thursday, we have decline in pip range. End of the week tends to slow down because traders prepare for weekend and some of the news are published which can have impact on their weekly result – sometimes in a bad way.

EUR/GBP Overview per Trading Session in a Week
From Monday to the middle of the week, Wednesday, you will have increase in EUR/GBP volatility. On Thursday you will have maximum peak and that day is the best day to trade if you are waiting for volatility.
Sydney and Tokyo session on EUR/GBP pair do not have high volatility. Chart gives information that range is between 15 and 30 pips which is not so much if you like to have volatile pair. From Monday to Friday on these two sessions there is no much difference. It means traders do not trade, to much, this pair on Asian time frame.
London and New York trading session are sessions you should pay attention when trading EUR/GBP pair. London average pip range is from 40-50 pips which is good for trading. New York is not so much good as London but it does not have so much difference. Pip range on New York session is from 30-40 pips.
From Monday to Thursday you can see pip range increase on London and New York. Middle of the week on these trading sessions is the best time to trade if you are looking for volatility.
Friday is the day when volatility decline in every trading session so London and New York are not an exception. They have decline in volatility because traders tend to close their positions and to have calm weekend without stress.
Which Trading Session Should You Trade
This is what you can take from these charts:
- Sydney and Tokyo session are not sessions you should watch out if you look for volatility
- London and New York session are sessions with most volatility on EUR/GBP
- Monday and Friday have less volatility compared to other days in a week
- Thursday is the day with highest volatility
- Friday is the day when volatility decline and if you do not want to trade on low volatility avoid this day
EUR/GBP Analysis – Daily Range
Here is an example how trading session is divided on the chart during a day. Chart shows information on GMT+1 time zone.
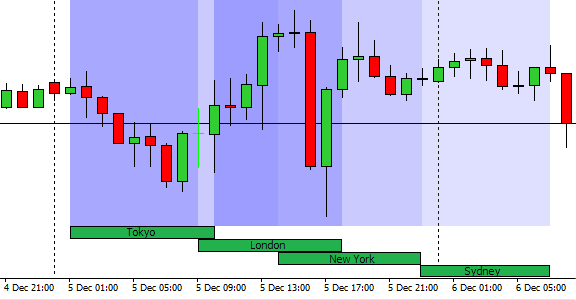
How EUR/GBP is doing on each hour during a day is shown on the chart under. Please have in mind that chart give average pip range. This means that values from chart can vary day by day.

Tokyo as first trading session on the chart tells that pip range is very low and traders do not trade this pair. Peak at 8 pips is very low and if you count spread on the pair which can be few pips it means that it is best to avoid trading this pair at this trading hours. Wait until London opens.
EUR/GBP Analysis – London Session
When London trading hour open then liquidity comes in and pip range increases. Volatility starts to come in and pip range increases around 9h up to 11h. Pip range goes up to 16-17 pips which is possible to trade.
Around noon there is slow down on pip volatility due to lunch time in Europe. When New York opens then volatility starts to pump up again because more traders are in.
When London session start to close around 17h volatility decline.
EUR/GBP Analysis – New York Trading Session
New York session starts around 14h and more traders gets in. Overlap on London and New York session have highest number of traders on the market and EUR/GBP pair becomes more volatile. This increase is visible on the chart on 14h where pip range increases few pips.
EUR/GBP pair does not experience to much increase in volatility during London and New York overlap like EUR/USD does because U.S. market does not have so much influence on the EUR and GBP like it have on USD.
EUR/GBP Analysis – Weekly Range
Weekly overview on the chart under this text gives more information what is average pip range on each day in the week. Chart tells when traders are more active during the week and which day you should watch to get more pips in trading.
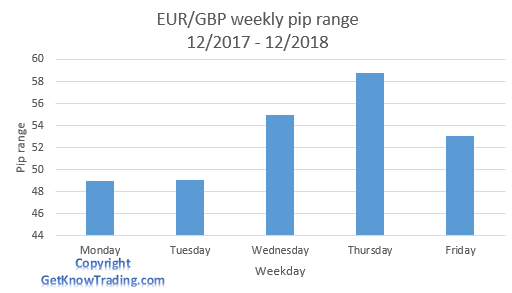
Start of the week is under 50 pips which for some traders and trading strategy can be enough. If your strategy is not based on high volatility, meaning you have long term strategy, then Monday and Tuesday, as days with low volatility, do not influence your trading.
If you are day trader and your trading strategy depends on pair volatility then you should check Wednesday and Thursday. These two days have average 50-60 pip range and it is enough to earn some money on day trading.
Friday – Day for Profit Lock
Friday as the last day in a week experience decline in pip range but it does not get low as Monday and Tuesday. Still, Friday is day when traders are already in trade from Wednesday and Thursday and they start to close their position and take profit.
Friday is known on all pairs that have decline in pip range and volatility because traders lock their profits, close order to avoid influence from news over weekend and because they prepare themselves for weekend.
Some news are published on Friday which have impact on the market. Some traders do not trade on that day because they want to avoid possible loss and mental weakness that can come when looking on the chart during news spikes.
If you have traded on the news then you understand what happens on your trade when news are against you. If you are not strong enough mentally you start to open new trade against your first one. You close current trade to avoid large loss and after few minutes after news are published and spikes are gone market starts to reverse and all what you have done becomes wrong decision.
When you close those bad trades which was open because weak mental condition then your profit for that day or even week becomes large loss on your account. This is something you should avoid on Friday or any day in a week.
EUR/GBP Analysis – Monthly Range and Pip Range History
Have you asked yourself what is EUR/GBP pip average on monthly basis?
Next chart gives you overview how EUR/GBP pair is doing over year and what happened in the past.
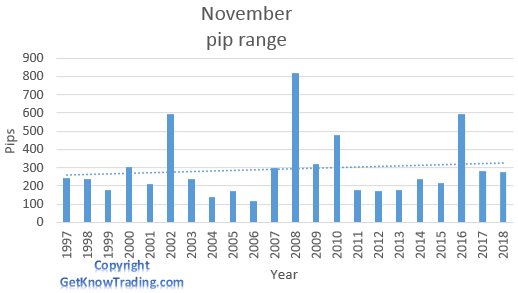
Chart shows that pair range is not so wide and EUR/GBP pair have very small volatility during any month in the year. Only 2 months have pass 300 pips which is not so much in terms of trading.
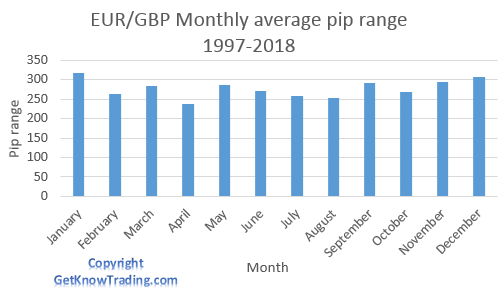
Here is a short overview how each month was doing in years before and what was key events that had impact on pair volatility.
January
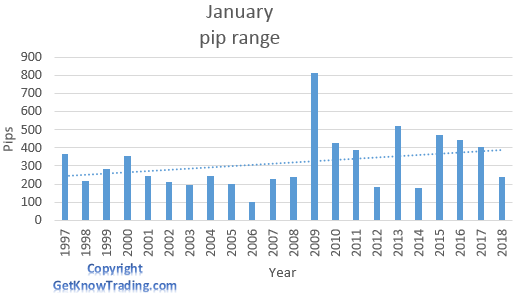
January is the first month of two months in year that have pip range over 300 pips. Even it is over 300 pips compared to some other pairs, like GBP/JPY who have average pip range around 1000 pips this range, is not so large.
Only spike appeared on 2009 when Major financial crisis hit whole market and large volatility influenced high movements.
2015 had large impact on the market by news from EU where ECB decided to unleash QE(quantitative-easing).
February
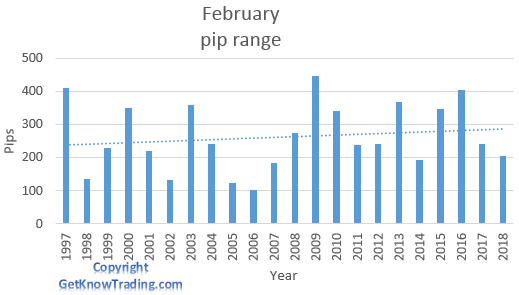
February had no large movements during past years and average pip range is holding under 300 pips. Years that had average pip range above 400 were financial crisis in 2009 and QE in 2015/2016.
March
March had one special month when financial crisis hit the market and spike above 600 pips appeared on that month. After that year nothing had so much impact on the market to move volatility on higher level.
Month is holding average pip range around 300 pips and it is not declining as some other months in last 3 year.

April
April is the worst month by average pip range because it is only month under 300 pips. Mostly it is around 250 pips which is not so much and compared to largest trading pair, GBP/JPY, it have 4 time smaller pip range.
If you do not like small pip range and volatility avoid this pair specially in this month.

May
May had no big events in the past even on major crisis in 2009. Only small rise on monthly pip range happened but comparing to January where pip range skyrocketed, we can say year 2009 was nothing for May.
In 1999 when EUR become currency it had momentum which lasted until May 2000 and then declined. This was the spike appeared in May on 2000.
If you look on the average line you will see that this is the first month with decline. Trend says pip range is falling down.

June
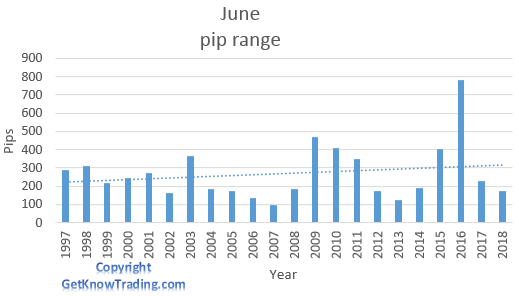
Month does not have large price movement but 2016 had increase in pip range volatility due to Brexit referendum from June 2016.
July
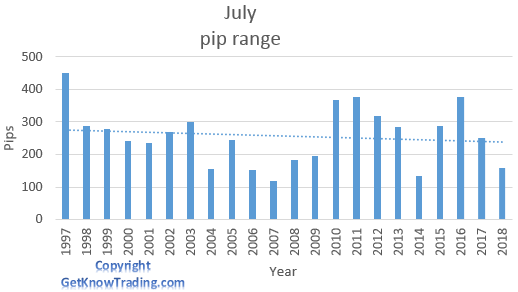
July is the second of two months which have decline in average pip range in years I have done research. There was no big events that could have impact on the monthly average pip range as we had on other months.
August
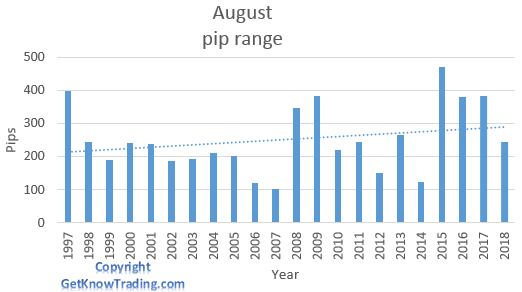
On August we see some fluctuation in 2015 and after that decline in pip range. 2015 and 2016 was the year for GBP when Brexit was actual news that had impact on currency.
September
Except 2009 when major financial crisis hit the market we have only 2016 and 2017 year worth mentioning where GBP had Brexit rumors that impacted market. After those rumors about Brexit silent down, pip range also slow down in 2018.

October
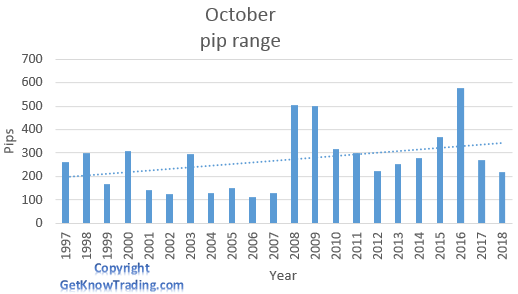
These events caused spike which is shown on the chart under this text.
- Read here for more information about global financial crisis in October 2008.
- On 22.10.2008. U.K. said they are in recession.
- Brexit in 2016
November
What sticks out is year 2008 where pip range was high due to October news that U.K. is in recession. This news had impact on the next month but with lower strength.
December
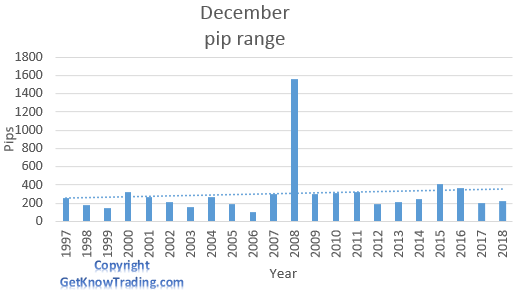
In 2008 major crisis had another impact on this pair and in December there were more bad news which caused spike on the monthly pip range.
EUR/GBP Analysis – Monthly Conclusion
What we can see on the history charts is that several major events had impact on the market:
- Major financial crisis in 2008
- UK recession in 2008
- Brexit in 2016
Without those events we would not have largest volatility more than 300 pips. Average pip range is under 300 pips which is really low. Even though pip range is low, looking from the past average pip range is rising. Only two months, May and July, are declining.
If you look for trading pair with high volatility EUR/GBP is not the one you should trade.
What Impacts EUR/GBP Volatility
What influence these two currencies is primary their economy. One of the highest indicator that have large impact on the currency is interest rate in each country.
Mostly when interest rates are increasing price of the currency is increasing. This is called International Fisher effect.When interest rate is higher in UK it means that GBP will rise comparing to EUR. When EUR interest rates is higher than UK, EUR will rise comparing to GBP.
Higher interest rates means currency
will attract more investors in that country where they can earn more money and
currency becomes more desirable.
Central banks – Institutions that affect the pair are the central banks, ECB and BoE(Bank of England). They regulate interest rates which as a result have currency movement.
Political factor have impact on EUR where several countries are in eurozone and when there is instability between them currency gets hit and value starts to decline. This political factor is one of the main issues they are facing because to many countries use same currency and each country have their one opinion on some topics. When you see this kind of behavior in eurozone you can plan to trade against EUR.
Connection Between Volatility and News
One of the key factors that has impact on Euro is interest rate. When ECB makes a move on the interest rate you can be sure that pair will move in one direction, sell or buy. ECB release report each month so you can watch out on this to trade pair and to earn some pips.
Employment report is another factor that influences euro. Report gives overview how employment is doing across Europe. It is important factor which you should follow.
Monetary policy of BoE, Bank of England, is one of key factors influencing pound. They act when inflation is to high or to low and control inflation to prevent undesired consequences.
Gross domestic product or GDP is another factor that have impact on the GBP currency, as on any other currency in the world.
GDP is overall information how country is doing and this information will have large impact on the price of currency. Pay attention when this information is published because currency will move in one direction if there is change in GDP value.
PPI, CPI, PMI and GDP
Indicators:
- PPI as Producer’s Price Index
- shows trends within sale markets, manufacturing industries and commodities markets
- CPI as Consumer Price Index
- Consumer Price Index measures inflation that is most important indicator of the economic health of that country
- PMI as Purchasing Managers Index
- shows us are purchasing managers optimistic or pessimistic about the economy
- GDP as Gross Domestic Product
- tells us how much the economy is strong, how does it advance and is it healthy or not
These indicators have impact on the price of any currency and they are ones which you should watch. Price index is telling how the price of consumer goods and manufacturing material is doing. These prices have impact on inflation and consequently on interest rates.
I will not go more into details about these indicators but you can check for more information on the links I have gave.
EUR/GBP Analysis – What to Take From Here
As I have give a lot of information in EUR/GBP analysis there is useful information you can use in your trading.
- Pair have low volatility
- London is the main trading session because both currencies are European currency and London session have highest volatility
- Use overlap in trading sessions, London and New York, to extract more pips because then you will have more traders and large volatility
- During a week choose to trade on middle of the week, Wednesday and Thursday because then you have best volatility and chance to grab pips from the market
- Watch for Friday – lock the profits you have to avoid impact from weekend news if there is any
- Any month in a year is good to trade. There is no big difference between them but if you do look for high volatility this pair is not good choice
- Watch out on published news and indicators that have large impact on the currency
Read more:
- EUR/USD Volatility – Pip Range Analysis
- GBP/JPY Pip Range Analysis – Account Widow Maker
- GBP/USD Pip Range Analysis – Cable Connection
- EUR/JPY Pip Range Analysis – Euro Japan Samurai
- EUR/CHF Analysis-The Biggest Crash in the Forex History
- USD/CAD Pip Range Analysis – Oil UP Pair DOWN
- USD/JPY Pip Range Analysis – Ninja Pair
- USD/CHF Pip Range Analysis – Swissie
- AUD/USD Pip Range Analysis
- AUD/JPY Pip Range Analysis
- NZD/USD Pip Range Analysis
- What is Meaning of XAU in Forex
- What is Meaning of CFD in Forex
- What is GU in Forex
- What is GJ in Forex

0 Comments