Support and resistance levels in Forex are one of the basic technical analysis components in Forex for beginners. Those are levels where traders try to buy or sell trading pairs.
You will hear or you already have that you should “Buy low and Sell high”.
This means when the price level is at the lowest area, looking from the technical side, you should buy and when the price level is at the highest area you should sell.
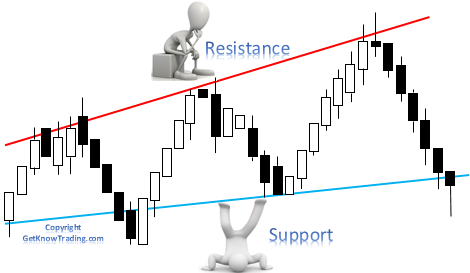
Those are areas where prices usually stop and change direction.
Here are the topics I will cover in this post and what you will learn when you finish reading it.
- What is a Resistance Level
- What is a Support Level
- How Does a Support and Resistance Levels Work
- Breakouts
- Retest
- What Makes Resistance and Support Area
- How to Draw Support and Resistance Levels
- Trading Based on Support and Resistance Levels
Contents
- 1 What is a Resistance Level in Forex
- 2 What is a Support Level in Forex
- 3 How Does a Support and Resistance Levels in Forex Work
- 4 Deeper Understanding of Support and Resistance Levels in Forex
- 5 Breakouts
- 6 Retest
- 7 What Makes Resistance and Support Area in Forex
- 8 Trading Based on Support and Resistance Levels in Forex
- 9 Conclusion
What is a Resistance Level in Forex
Resistance level in Forex is a technical indication tool used by traders to identify trends of the currency and to identify level of resistance. It is very helpful in predicting where the price could move to earn money by trading. In a post about Metatrader 4 I have shown you where the trend line is located.

Resistance level in Forex is a line that is always drawn on the upper side of the trend. It is on the upper side of the trend because it makes a resistance to trend and price to go higher.
Resistance line shows us where the price tends to stop rising and where there is potential selling pressure because it indicates where the supply is located.
Who makes a resistance level:
- potential sellers who will or have sold a Forex trading pair
- buyers who have decided to exit from their trade at that level
- buyers who have bought trading pair before price felt to previous resistance and now wants to come back to old resistance just to get out at breakeven
What is a Support Level in Forex
Support level in Forex is a technical indication tool used by traders to identify trends of the currency and to identify level of support. It is very helpful in predicting where the price could move to earn money by trading.

Support level is a line that always is drawn on the down side of the trend. It is on the down side of the trend because it makes a support trend and price to go down. Support line shows us where the price tends to stop falling and where there is potential buying pressure because it indicates where the demand is located.
Who makes a support line:
- potential buyers who will or have buy a Forex trading pair
- sellers who have decided to exit from their trade at that level
- sellers who have sell trading pair before price rise to previous support and now wants to come back to old support just to get out at breakeven
How Does a Support and Resistance Levels in Forex Work
Resistance level works as a barrier for price when it goes up and the support line works as a barrier for price when it goes down. Whenever price hits the line it could bounce. Resistance and support level have these characteristics because all traders follow the same principle and that principle is when the level next to resistance or support line is reached it will bounce.
If there are more other technical tools that show the same behavior around that level, like round number on support/resistance level or Fibonacci levels, price will bounce from that line.
There is major/strong and minor/weak resistance and support level. Major or strong level is the one that will have a higher impact on the price when the price reaches this level. Minor or weak levels will have lower impact on the price movement.
Read more: How to Draw Support and Resistance Trading Line
Major Level
Major or strong level will impact on the price in a way that it will change price movement for a longer period of time or bounce with a larger pip amount.
Larger period of time is not a rule and it does not need to be in this case because price can be pushed from resistance or support line for large amounts of pips in a short period of time.
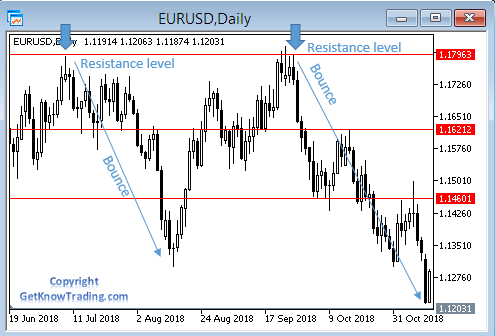
This often happens when there are several indicators showing that prices have reached strong resistance or support level.
But sometimes it can happen that the price bounces from strong resistance or support level and it takes a lot of time to move.

Minor Level
On the minor or weak resistance level price can bounce a small pip amount but it can happen to bounce a lot. This cannot be calculated and each trader should have risk management when trading bounce from resistance line.
Uptrend and Downtrend
Resistance or Support level is developed when price stalls on the same price level for two or more times. When this happens we draw a resistance or support line as a horizontal line. This line represents a level where the market has a problem and it is struggling to move past that area.
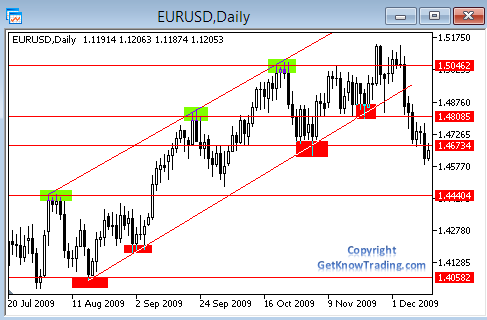
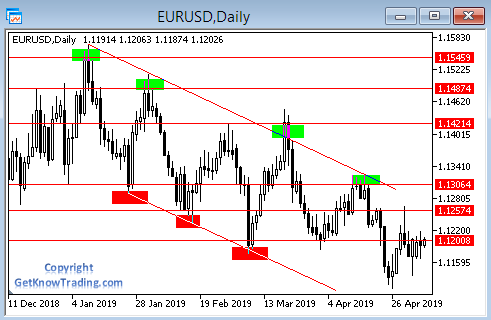
If the price makes higher highs, which indicates we are in uptrend we can draw an angled line which connects those highs. This angled line is a resistance line and we read it as an uptrend line. Angled lines are called dynamic support and dynamic resistance area.

When the market moves in downtrend and makes lower lows we draw a support line that connects those lows. Support line is drawn as an angled line and we read it as an downtrend line.

Resistance or support level should not be remembered as a line but as an area, price range. It cannot be a line because the market will not hit a specific price always but it will come close to that price level or it will pass that price level and then bounce.
All traders should have in mind to place their orders and stop loss/take profit in the area around support/resistance level to get the best result.
Read more: How to Perfectly Draw Trend Line in Forex Trading
Deeper Understanding of Support and Resistance Levels in Forex
When support and resistance level is tested by the price that level becomes stronger or weaker. Which one becomes you will not know until it happens in breaking out or bouncing back. So, mark those areas and watch how it behaves when the price hit that level. Wait for some sign of confirmation in case of breakout or retest to confirm setup.
Testing Resistance Level in Forex
When the trend is going up, the uptrend, watch does market makes higher lows next to resistance level.
If lows are coming closer to the resistance line it means that the resistance level is tested and the market will probably break and resistance level will not hold.

Resistance level becomes weak because there are more buyers than sellers. Have in mind that there is no rule that resistance will break and price will continue to rise up. It can happen that the price breaks support level like in the scenario on the above image and price drops below support level and changes direction of the trend.
In another scenario the market will not make higher lows next to resistance level and it will bounce back. It will happen when it bounces back that it will not come to resistance level for a longer period because on that level there are large amounts of selling orders. This means the resistance level is strong and it will be hard to break out.
Testing Support Level in Forex
Same scenario is happening when the market is going down, downtrend. If lower highs come closer to support level it means the support line is tested and the market will probably break and support will not hold.
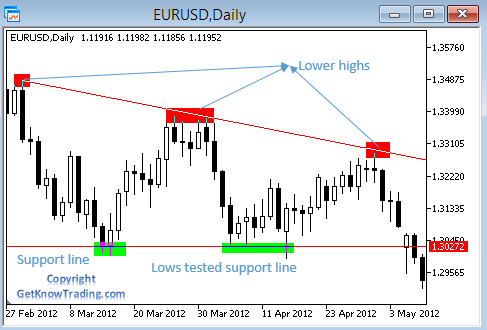
Support levels have become weak because there are more sellers than buyers.
In another scenario the market will not make lower highs next to support level and it will bounce back. It will happen when it bounces back that it will not come to support level for a longer period because on that level there are large amounts of buying orders. This means the support level is strong and it will be hard to break out.
Remember
Higher lows next to resistance level which is defined as an ascending triangle mostly result in a breakout but it is not mandatory that it will happen in that way.
Lower highs next to the support level which is defined as a descending triangle mostly result in breakdown but it is not mandatory that it will happen in that way.
Breakouts
Support and resistance levels in Forex are levels where price will have confluence and will bounce from it. Sometimes those levels are not respected and the price continues further. But then price returns to those levels and reverse direction, it bounces back.
This behavior is called false breakout because we thought that price has passed support/resistance level and it will continue in that way. But price returns back and bounces. This is a false attempt.
This happens because support and resistance level is not a specific price level but it is an area, a price range, where price can fluctuate and thus allow price to go up or down when it hits those levels. You need to count variable price levels around those lines.
To trade false breakouts is not so hard but also it is not so easy. You need to wait for a breakout to happen and then open a trade when it starts to return to resistance or support level. Your stop loss should be placed behind support or resistance level to avoid being hit by the price.
Retest
Retest is when the price breaks horizontal support or resistance and reverses back to that area where it bounces and continues in direction of breakout. It is a kind of confirmation that breakout is valid and old support is new resistance or resistance is support.

Retest happens when a market trend reset itself and a new trend is developing. Behind scene scenario would be where buyers and sellers change power in the market.
When breakout happens price tends to get back to its previous level. To confirm that this is a retest you need to watch for some kind of confirmation. It is not enough that price come back on the previous level and you enter into trade thinking this is retest and price will go in your direction.
You need to wait until the price pattern as confirmation happens on the support or resistance. That, mostly, is pin bar, bearish or bullish pin bar which indicates that reversal is happening.
If the market does not make a price pattern as a confirmation just pass away to the next opportunity. You can try and open a trade in this setup but you will have more success with better setups. You should not hurry opening a trade that is not confirmed because tomorrow comes another opportunity to trade and earn money.
What Makes Resistance and Support Area in Forex
In the Forex market there are many types of traders and all of them have few characteristics which define the market.
Those are:
- Traders with the fear of missing out of opportunity
- Traders who are greedy and want to get the best price
To explain it more clearly here is an example. If you are a trader and you want to catch the move to earn a lot of money without being left out you will place an order before the price comes to the support or resistance line.
You will place an order several pips before just to be sure your order will be triggered so you do not miss the chance to get into the trade. Your way of thinking many traders on the market have and they will place the same order. That order will be before the support or resistance line and when a large amount of traders do the same and that area becomes filled with orders it will trigger the market to bounce before reaching support or resistance line.
Second example is when you want to get the best price and you wait until the market comes to support or resistance line or even pass that line. You want to open a trade right on the line price so you do not miss any pips you can take.
If a large amount of traders do the same price will come to the support or resistance line and sometimes pass the support or resistance line and then bounce.
Now when you understand how this works you can understand why the support and resistance line is an area, price range, on the chart. You do not know who is in the market, first or second group of traders, so you need to calculate both scenarios.
Trading Based on Support and Resistance Levels in Forex
How to trade support and resistance levels is not hard and there are rules traders must follow in order to be successful with this trading method.
Basic trading method with support and resistance line is to buy next to support level in uptrend and to sell next to resistance level in downtrend. Some traders will look for reversal and others will look for breakout.
Traders should pay attention in trading with support and resistance levels to open trade inline with trend. If the trend is going down there is a higher probability that selling currency pair will give better success and when trend is going up buying currency pair will give more chance to be profitable trade.
There is no 100% system that will work with the above strategy but with good money management and waiting for some other confirmation like a chart pattern will increase the chance of success.
Stop loss should be used in any trading technique. In this case when buying currency pair place stop loss several pips below support and when selling currency pair place a stop loss several pips above resistance.
This way you are expecting that support and resistance line will hold and price will not breach those levels. If you play with the trend and use a very good R:R(Risk:Reward) ratio you will for sure be profitable in the long run.
Exit Strategy
When you open a trade based on the support and resistance levels plan to have an exit strategy which should follow next steps.
When you buy next to support the level plan to exit before price hits strong resistance. If you sell a currency pair next to the resistance level plan to exit before price hits strong support.
You can plan to exit on a minor support/resistance level if you are not sure that price will reach a strong level. This is something you need to watch on the Metatrader 4 trading platform when trading because the market does not behave as we would like.
Trending Support and Resistance Levels in Forex
Support will probably break in downtrend and resistance will break in an uptrend.
When the trend is in the uptrend it makes new highs which means the market price is breaching previous resistance levels. To continue making an uptrend it needs to make new highs and to open a trade with sell order on the resistance level is not a smart idea because you will bet against the trend.
To open order against a trend is not smart and you should always try to go inline with the trend. You need to watch for opportunities to open buy orders when the market is in uptrend.
When the trend is in the downtrend it makes new lows which means market price is breaching previous support level. To continue making downtrend it needs to make new lows and to open a trade with buy order on the support level is not a smart idea because you will bet against the trend.
To open an order against a trend is not smart and you should always try to go inline with the trend. You need to watch for opportunities to open a sell order when the market is in downtrend.
Trading Strategy
- Mark Support and Resistance levels on the chart
- Watch market until it comes to these levels
- Watch what happens with the price
- is there any price patterns signalizing reversal
- After pattern is shown enter new order with stop loss above pattern high or low depending on the market direction
- On the next support or resistance levels take profit
Conclusion
- If Support or Resistance levels are tested it becomes weaker or stronger
- Support and Resistance levels is not a line but area on the chart
- When trading Support and Resistance levels leave enough space for price and set wider stop loss or take profit
If you think this was useful share it with your friends so they also can learn from this tutorial to become a Forex trader.

0 Comments