Drawing trend lines is not an easy task, but if you draw them correctly you will have a nice picture what is market doing.
Where the market will move in the future you will have more success predicting with trend lines.
Trend lines in technical analysis are dynamic support and resistance levels which means the price level can move in time. It is not horizontal line that stays on the same place all the time, but it moves through time.
How is that? Read further and find out.
Contents
How to Draw a Trend Line Correctly
When you draw a trend line on the chart you need to avoid putting lots of lines because you need to keep a clean chart. Clean charts are easier to read and to read potential signals for sell or buy order. Clean chart must contain only trend lines which are important for trading decisions.

Which trend line is important and which you can ignore?
If you have no idea then continue reading and I will explain.
Steps for drawing trend line:
- Find only major swing low and high points and minor one ignore
- Use trend line and connect two major lows or major highs
- try not to cut body of candle when connecting swing high/low
- If the trend line passes next to another swing point, adjust your trend line to touch that one. You need to look to touch as many as possible swing points to get better trend line area
- use higher time frame like daily time frame
- do not force a trend line to fit the market – if there is not trend move forward to another pair
Downtrend Example
For a downtrend you need to connect only lower highs because the downtrend line is drawn above the price. In case of uptrend you need to connect higher lows because uptrend line is drawn below the price.
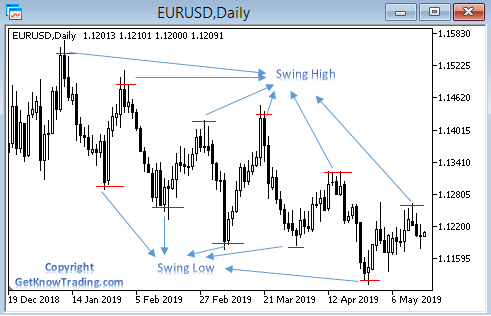
In the image below I have pointed several swing high and swing low which I will use for connecting them and making a trend line.
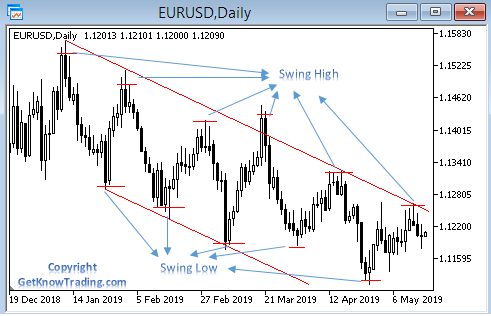
In this case I will make a downtrend line but also a second line above the price just to get a channel to give you a better overview how price follows trend lines.

When a trend line is drawn and at least two lows or at least two highs are connected we get a trend line as in the image below.

I have connected at least three lows which makes a trend line better and confirms that downtrend line is valid.
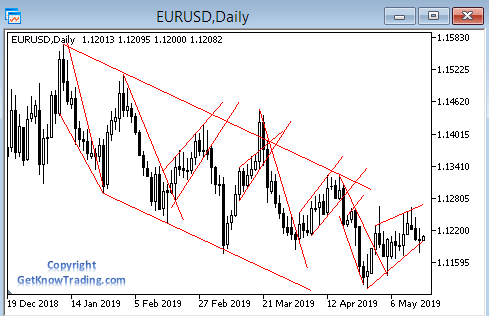
You can see minor swings high which are not connected with the trend line. You can make new trend lines and connect them together like I have done on the image below.

The thing is when you connect minor swings with another trend line you get an area between two trend lines. In my case above I have two trend lines in a downtrend where swing highs are connected. Area between those two trend lines gives you the price area where price could bounce.
In this area you can watch to exit your trade if you are in buy order or you can wait for the sell order to be activated.
Connect Body or Wick
Will you connect the lows of the body or wick it depends on you because both ways are valid. I like to use both but when I want to close a trade mostly I use end of body instead of wick.
Why do I use the body?
When you take a look not all candles have a wick but it has an end of the body. So if you count all ends of the body and all wicks you will get information that the end of the body is more seen than wick and thus there is more chance my Take Profit will be reached.
Have in mind not to cut the body of the candle when connecting the end of the body. Sometimes it will happen that the trend line cuts the body of the candle but it is rare. If that happens you can start to watch trend lines as not valid any more. I have to point out that sometimes even if it cuts the body of the candle trend line can be valid for future use.
Conclusion
Here is short overview to take it with you what you have learn in this post:
- Trend lines are drawn at an angle
- In an uptrend trend line is drawn below the price
- In an downtrend trend line is drawn above the price
- to draw a trend line for uptrend you need to connect at least two higher lows
- to draw a trend line for downtrend you need to connect at least two lower highs
- trend line can be used as support or resistance line where you can enter trade when price reach those levels
- the more obvious the trend line is the better results will be
Read next: What is a Trend Line in Forex

0 Comments