This article will show you how to draw support and resitance level in Forex.
Support and resistance level are two important levels in technical analysis you need to know and understand in order to be profitable trader.
There are certain rules you need to follow to draw them correctly and to have better overview of the market on your charts.
Contents
How to Draw Support and Resistance Line/Level/Area
- Use desired chart type
Select chart type which you like to use and which gives you the best picture of the market. This way you will easily find areas where the market makes a support and resistance.
- Find Swing Highs and Lows
You need to find a place on the chart where the market turns direction of movement. Those areas give you the best place where buyers and sellers are waiting or closing their trades.
Swing high or low you can use on any time frame you like to analyse but remember that the best one is on a daily time frame which gives you the best setup. On a lower time frame you will see short swing high and low and those levels will not be correct on a daily time frame.
- Connect Swing High and Swing Low Levels
When you find swing high and low, put a horizontal line on the chart so you get a better picture where those areas are. Always use two or more swing highs or lows and connect them. After you put horizontal lines you will see how the market behaves. Is the market in the downtrend or uptrend or is it going sideways.
By connecting horizontal lines on highs and lows you will see where support and resistance levels are. You will see that horizontal lines you connect are connected directly on the same level. That is fine because you are not looking for a fixed price for support or resistance level but you are looking for where price will find resistance or support.
Use Desired Chart Type When Drawing Support and Resistance Level
Important step is to select the best chart tpye that will give you the best overview of the market status.
I am using candlestick chart because candles give me details I cannot see on other chart types.
Candlestick chart also gives me possibility to see candlestick formations that can give me good entry signal.

Candlestick also give me better look where was the open and close with high and low of the timeframe I am looking at.
Highs and lows with open and close are very important information when drawing support and horizontal levels.
These information tells you how the price has closed the time frame you are looking at, and how the trading day has ended.
You can also see how high the price managed to go on that time frame and what was the low that bears managed to reach.
Find Swing Highs and Lows
Next step is to connect swing highs and lows on the chart.
Swing high or swing low is a point where the price has changed the direction. The change must be on a higher scale.
This means if you see small change of a direction and then the price return back on the previous direction then that is not a swing. Is is small pullback.

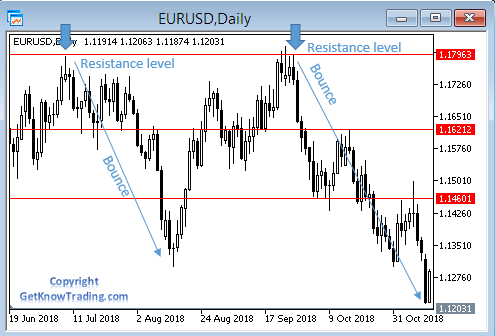
In the image above you can see points I have marked with arrows.
Those are turning points called as a swing point. In this case we have a horizontal resitance level that has turned the price in the opposite direction.
You can see that the price has turned the direction and it moved for a period of time until it comed back.

Swing point is also visible on the image above where the swing point was at support level.
The price has come to the support level and then bounced back in the opposite direction.
You can see that on the both images you have several turning point near the same price.
Connect Swing High and Swing Low Levels
In the first image you can see resistance level with two turning points.
When I connect those two turning points or swing highs I will have horizontal line that is called resistance level.
In the second image I have done same thing, but on the lower side where the swing lows are.
When I connect them I get a horizontal ine called support level.
Smaller Swing High and Low
As you can see in the images you have smaller swings. When you connect them with a horizontal line you get another support or horizontal level.
You can have several horizontal lines on the same chart, but the lines that have more touching points will have more strength than those with less touching points.
The stronger level with several touching points is major level where you can expect to have a confluence. Confluence level is an area where buyers and sellers are waiting to jump in or get out from the market.
At these areas you will have a brekaout or a bounce. To predict correct outcome you will need to watch the market and make a good trading strategy.
Conclusion
Drawing support and resistance level is not so hard when you know what you are doing.
If you do not have enough experience then you can expect to make mistakes in drawing horizontal lines, but as your progress in time you will see what is good and what is not.
Important is to continue drawing them and reading a lot.

Thanks. Post is great and helpful
Thanks Max for your comment.