Setup chart on Metatrader 4 Forex trading platform is not so hard if you know how to do it. If you are beginner then you need help and I am here to help you.
If you have followed previous posts until now you have Metatrader 4 on your PC and account with available balance for trading.
If you do not have Metatrader 4 and trading account please return to the previous steps and get them in order to follow further steps.
Download and Install Metatrader 4
If you done it all what it takes to have Metatrader 4 and account please continue.
You have many questions that bothers you and you do not know where to start. Questions are mostly how to:
- Open a Chart
- Setup Chart Properties
- Save Chart Setup as a Template
- Load a Chart Setup Template
- Add Moving Average and Other Tools
- Setup 4 Primary Time Frames in One Market Profile
- Analyze Multiple Markets
- What Type of Chart is on Metatrader 4
- Modify the Chart Type
- Set the Language
I have explained them all and included images so you can see what I am talking about. Important thing to take it from here is to practice directly on the Metatrader 4 what you read and learn.
1. How To Open a Chart on Metatrader 4
There are three ways you can open a chart on Metatrader 4 and all of them are easy to do. Which one will you use it depends on you.
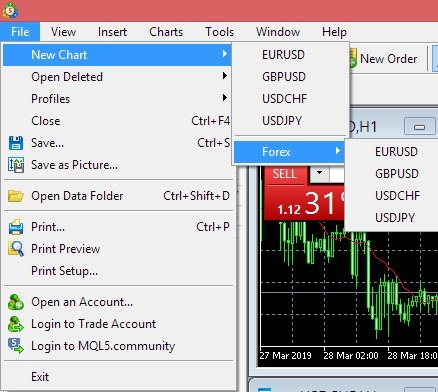
a) Open Chart Window Through Main Menu
On the image below I have shown step how to get to first step when you want to open chart on Metatrader 4. Here is an explanation.
You need to position yourself on the main menu under tab “File” and select “New Chart” which will show you more options.
Under new menu select trading pair which you want to show chart for. On the first few rows it will show you a list of trading pairs that are currently first on the list in “Market Watch” window.
As I have shown you in the last post “How To Use Metatrader 4” what is under Market Watch and how to show more or less trading pairs you can change a list of available trading pairs.
In this case I have start list with four trading pairs and that is why you see them on this list on the image. You need to select one. I will use EUR/USD trading pair.
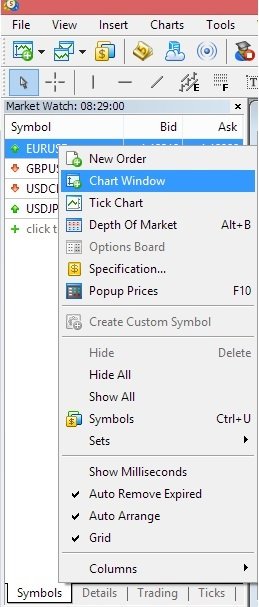
b) Open Chart on Metatrader 4 Through Market Watch Window
When you are in the “Market Watch” window you can just right click on the trading pair you wish to show and new menu will appear.
Select “Chart Window” and chart will show on the right side.
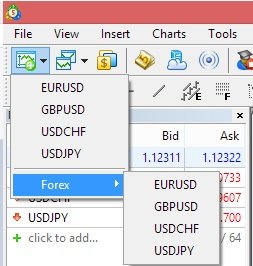
c) Open Chart on Metatrader 4 Through Fast Menu “Create a New Chart“
Last way to open a chart is with quick menu button like on the image below. When you click on the button you will have a list of all Forex trading pairs that are currently available to you.
First four are the ones you have on the top of the list in “Market Watch” window and rest of them is under “Forex” list. Because you have only four of Forex trading pairs you cannot see any other trading pair in the list.
When you click on any Forex trading pair immediately chart will open on the right side of Metatrader 4 platform.
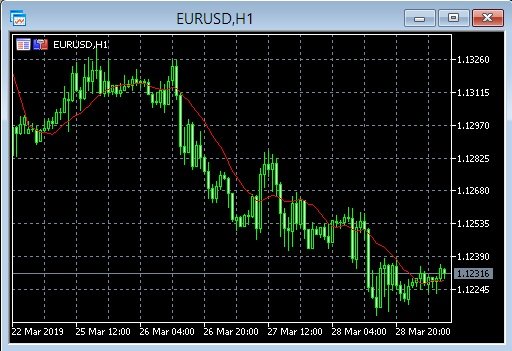
I have open EUR/USD trading pair chart and this is what I get. As you can see I have:
- black blackground
- candlestick chart
- moving average
- candlesticks are green (bear and bull candle)
2. How to Setup Chart Properties
If you want to change those properties to have clean chart you need to do few steps. In order to do this you need to change chart settings like background color, candlestick colors.
You need to open properties by clicking right click on the chart and menu will open. At the end of the list select “Properties” which will open new window with all settings you need.

You have window with 3 tab:
- Common
- Show
- Colors
For you only last two are important.
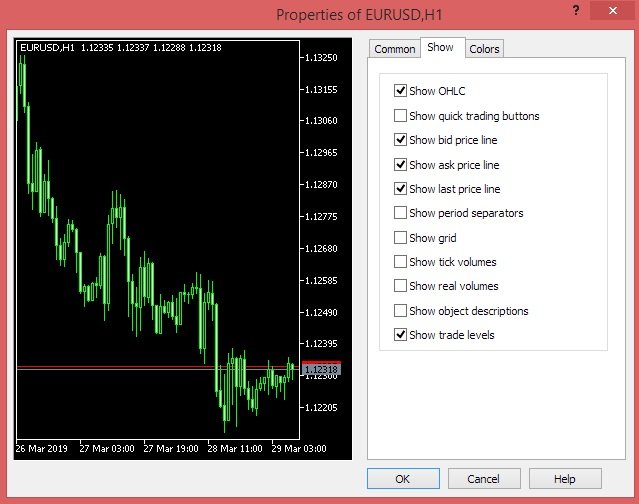
2.1. Chart on the Metatrader 4 – Show
On the “Show” tab you have several check boxes you need to select. Please take a look on the image below and select them as it is shown.
Whatever you change that change is immediately visible on the left side on the chart. This is very useful to see any change you apply before confirming it. You can test whatever you want and before saying “yes that is what I need” you can test it.
Here is a short overview what each setting means:
- Show OHLC
- On the left upper corner you can see row with name of the trading pair that is currently shown, EURUSD
- You have OHLC(Open-High-Low-Close) price of candlestick on the time frame you are currently seeing
- Show bid price line
- line that shows you what is current bid price of trading pair
- it is grey line on the chart on the left side
- Show ask price line
- line that shows you what is current ask price of trading pair
- it is red line on the chart on the left side
- Show last price line
- show/hide the level of the price at which the latest trade was executed. This line can only be displayed if the appropriate symbol price is provided by the server
- Show trade levels
- show/hide the price levels where a position was opened or a pending order was placed, also the levels of Stop Loss and Take Profit.
2.2. Chart On metatrader 4 – Colors
Next tab “Colors” is used to change colors on the chart. You can change colors as you wish and I have set it up like on the image just as example.
Later on I will change them into better looking I like to have.
Advice I can give you here is that you should make a chart as clean as possible. Chart colors should be non invasive so you can look in the charts for longer period of time.
If you select pink color as your background you will not be able to look at the chart to long. The best background is white color and candlesticks should be white and black.
Those two combinations you should select if you want to have great visual appearance.

2.3. Chart on the Metatrader 4 – Clean Chart
After you have selected desired settings you can close “Properties” window and you will have chart set up.
On the image below I have:
- white background
- green bull candle
- red bear candle
- ask/bid price line
- OHLC list one the upper right corner

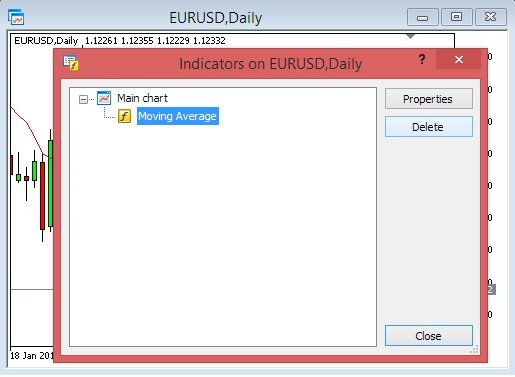
2.4. Chart on the Metatrader 4 – Remove Indicator
Some charts at start will have moving average or another Forex trading indicator placed on the chart. To remove that indicator you need to press right mouse click and select “Indicator List” menu.

New window will show you all indicators that are on the current chart. To remove them select each and on the right side press “Delete“. This will remove them from the chart and you will have clean chart.
3. How to Save Chart Setup as a Template
When you have setup all chart settings and you are satisfied with them you can save those settings.
Each time when you open new chart he will have preset settings as you have seen on the start of this post. Black background, green candlesticks, some indicators, without ask price line. That kind of chart is not clean and good to trading.
To save your time and avoid setting again those settings you can save those settings one time and just load those settings on new chart.
Here is the how to save those settings and have them ready for next chart.
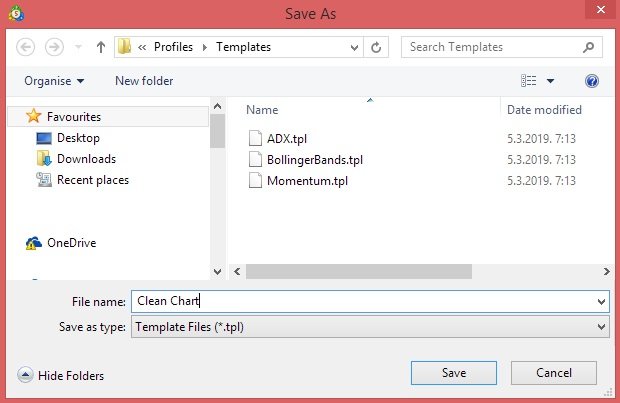
3.1. Save Template
When you have setup chart with settings you wish to have all the time and ready for next chart press right click on the chart and a list of selection will appear.
Select “Templates” and under list of choices use “Save Template“.

New window will appear and ask you to select destination for your template to be saved.
Normally Metatrader 4 offer standard destination for templates inside installation folder. You can select it or change it to your preferred location.
I will use standard location and save it together will other templates as on the image below.
Name your template as you wish. I have named template as “Clean Chart“.
That is all what is needed to do when you want to save template. You can save as many as you wish but if you have more of them give them different names that describes those templates in a way that is clear and understandable for you.
4. How to Load a Chart Setup Template
When you need to load template you have previously saved for future use you can press right click on the chart window and new menu will appear.
Go to “Templates” and under list select “Load Template” which will open new window.
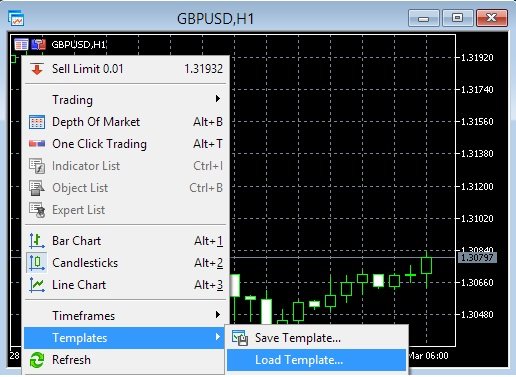
New window will open standard location in Metatrader 4 for templates. If you have saved your template here you will see it under name you have given it.
If you have saved it somewhere else you need to find that location.
I have named my template “Clean Chart” and when I select him my chart will have all settings I have setup earlier.
If you change any settings or add any indicator on the chart in time and when you load template have in mind that everything that was added will be removed. Unless you save again template under same name with all modifications. If you do that template will have all modifications saved.
What you have saved in template which you will use, that is all what you will have on the chart after loading it. So pay attention on that when loading because it can happen that you set up resistance and support line, moving average indicator and after loading template you lose everything because template did not had all those tools saved.

4.1. My Chart Template
Here is template I will use through this guide and in the future for trading. If you want you can setup it like I have.
Here are the settings you need to set on the properties menu. You can save this template as I have shown you above so you can easily open it on other trading pairs chart.

5. How to Add Moving Average and Other Tools
Now when you have clean chart you can add whatever you want. You can add moving average, draw support/resistance/trend line and all other stuff you need to be profitable Forex trader.
5.1. Chart on Metatrader 4 – Line Toolbar
To draw lines you can take a look in the image below that shows you toolbar with available lines. Also, there is bar with time frames available for charts.
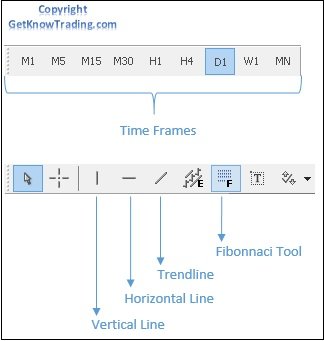
Three lines you will use for sure are:
- Vertical line
- you can use this line for pointing a time on the chart where something important happened
- Horizontal line
- this line use for support/resistance zone where price make reversal or breakout
- Trend line
- use this line to define trend on the market movement
Here are images I have done for you to see how it looks like when you use horizontal line and trend line.
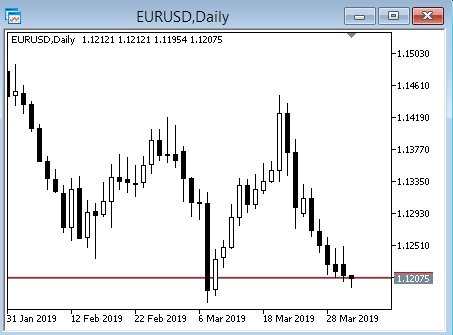
5.1.1. Horizontal Line
On the image below black horizontal line is placed on the price where many times price have tested and bounce back. It means that this place/price is important so I have draw line on it to clearly see it. Without line it is a little bit hard to see it immediately if you do not have trained eye.

5.1.2. Trend Line
When you use trend line as I have done it on the image below you can present to yourself where the price is heading.
What is current trend, bull or bear trend.
On the image below I have used Daily D1 time frame and draw trend line to show where the trend is heading. In this case it is visible that trend is bearish and price is going down.
Trend lines are very useful as auxiliary tool in Forex trading so use them as much as you can.
I will use them all the time so you will get familiar with them pretty good.

5.2. Chart on Metatrader 4 – Time Frame
Time frame bar gives you several choices on time frames which you use in your trading. From smallest “M1” – 1 minute chart to “MN” – monthly chart.
I will use daily D1 chart in my trading because daily time frame gives me the best setups for trading Forex.
You can use also other time frames like H4 to confirm entrance of trade setup or exit position because smaller time frame gives you zoom picture on the market.
Fibonnaci tool is tool I use to confirm my resistance/support level and confluence level. Confluence level is where several factor meet around and thus confirm that level as point where the price could retrace/breakout or whatever trade opportunity is there. This topic will be covered later in future posts.
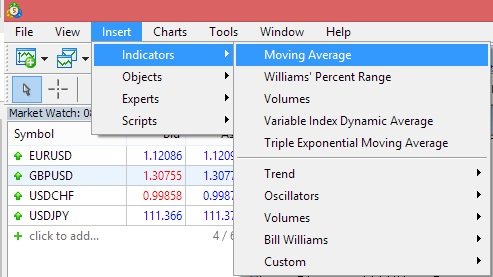
5.3. Chart on Metatrader 4 – Insert Indicator
You can add which indicator you want and list of them is pretty large. In my trading I use rarely any of indicators from the list but here I will show you where they are located and how to insert them.
One indicator I will show you is Moving Average which many traders are using in Forex trading.
Two images below shows you 2 step you need to perform in order to insert MA on the chart on Metatrader 4.
First go to “Insert” menu and select “Indicators” sub menu where you will get a list of available
- indicators
- oscillators
- volumes
- custom indicators
Select first on the list “Moving Average” and new window will appear.
New window shows you properties of Moving Average indicator. Every indicator have their properties so you can expect to fill some necessary information into this window.
Different values have different results so please have a look which moving average properties are good to have for day trading.

When you confirm settings for moving average you will immediately see MA on your chart. I have insert one MA and it is visible as red line on the chart on image below.

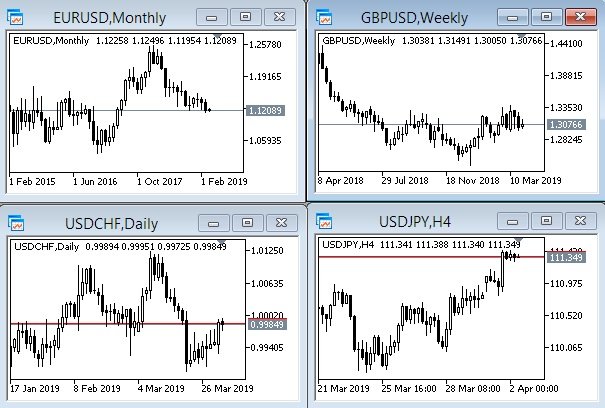
6. How to Setup 4 Primary Time Frames in One Market Profile
You can have many time frames at the same time on the Metatrader 4 trading platform. But for clean and visible display I do not suggest to use more than 4 charts at the same time.
Each chart can be set to different time frame so you can have monthly, weekly, daily and 4 hour chart at the same time. You can use any other combination of time frames.
On the image below I have set 4 charts with highest time frames and all are on the same currency trading pair. Now I can analyse trading pair in more detail on different times and see how it behaves. By reading different time frames you can see if trading pair have same trend or not.

You can save this chart layout as a profile so you can just load it and you do not need to set it again from start. Select “Manage Profiles” button as on the image below and “Save As“.

This way you can switch between several profiles by selecting it here on this menu or with shortcut:
- Shift+F5 for Previous profile
- Ctrl+F5 for Next profile
Read more: Metatrader 4 Shortcuts
Note: Remember, when you setup chart ready to save as a profile do not change anything until you save it. When you save it immediately change to another profile if you think to change something, like add new chart. If you add new chart without changing to another profile you will change saved profile and saved profile will have added chart.
7. How to Analyze Multiple Markets
You can open several trading pair charts and look at them simultaneously or you can switch between them. When you open several trading pairs you will have them listed under chart window.
On the image below you can see on the bottom a tab list of three trading pair I currently have open on Metatrader 4 trading platform.
When you want to analyze or change something on any chart you just need to select it and chart will show. Selection is done on the tab on the bottom of the image.
I am using this tab on the bottom all the time when changing chart from one trading pair to another. It is very easy and I have them at my hand for analysis.

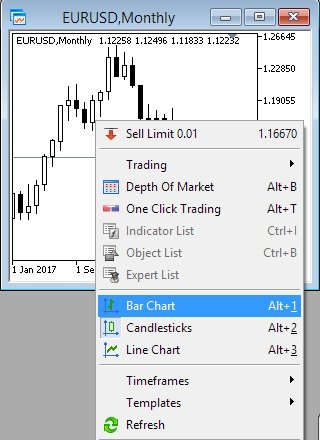
8. How to Modify or Change the Chart Type in Metatrader 4
Whenever you want you can change chart type in Metatrader 4 between three types that are available on trading platform.
Each chart type in Metatrader 4 represent trading pair price in time but difference is how it is shown to you as a user. Some of them are better and give better user experience and some does not help so much in defining situation of the market.
To change chart type take a look on the upper toolbar of Metatrader 4 trading platform. I have put image of the toolbar in the next step where you can see small icons of bar, candlestick and line chart type.
Just by clicking on the small icon you can change chart type on Metatrader 4 trading platform.

Another way to change chart type on Metatrader 4 is to position yourself on the chart and right mouse click. New window appear with all possible settings you can change.
There you can change chart type on Metatrader 4 just by clicking on it. Immediately you will see change on the chart.
9. What Type of Chart is On Metatrader 4
There are three types of chart on the Metatrader 4 trading platform. Here is explanation of all of them and in one place to see what is difference and which one is better.
9.1. Bar Chart
Take a look on the chart below. It is EURUSD Monthly bar chart. You can see many bars showing falling trend. What each bar represents is shown on the image below under the chart.
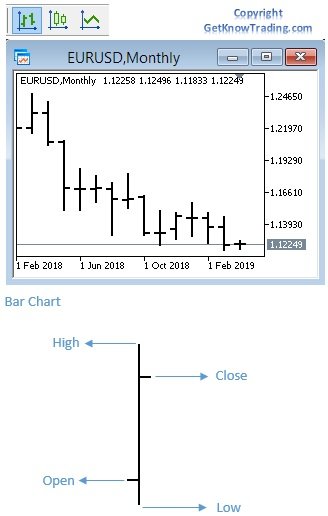
Bar contains all information you need to read the trading pair price. Each bar represents time frame which is defined by you when you select time frame. In this case I have monthly M1 time frame and thus one bar represents price of trading pair in one month period.
Each bar have four important information. Those are:
- High
- information what is monthly high price
- Low
- information what is monthly low price
- Open
- information what is open price when month has started
- Close
- information what is close price when month ended
Remember that those information’s depend on the time frame you are looking at. If you look on daily D1 time frame all above stated is for daily case and not monthly.
What can be hard to notice is difference between bar in uptrend ad downtrend. As you can see there is not difference in color of bars when price is moving up or down.
You need to see when is open and close price to define is it:
- bull bar
- price is moving up
- bear bar
- price is moving down
To compensate that problem you can change color for bull and bear bar which will help you to distinguish between bull and bear bar.
Another option is to change char type to candlestick chart.
9.2. Candlestick Chart
Candlestick chart type is the best one and which I use all the time. It is similar to bar chart but difference is only on body type of the bar which represents trading pair price.
Image below shows you chart with same time frame and timestamp like the above bar chart. You can see that both charts shows downtrend on EURUSD trading pair. They are same expect bar and candlestick.

On the image above I have described candlestick that represents trading pair price in one month period. Candlestick shows same information in same period of time as bar chart I have explained before this.
Candlestick contains four information:
- High
- information what is monthly high price
- Low
- information what is monthly low price
- Open
- information what is open price when month has started
- Close
- information what is close price when month ended
Candlestick differs from bar chart only in thickness of body. Bar have one line and candlestick have wide body which can be filled by color. In my case I like to have:
- white body for bull market
- price is going up
- black for bear market
- price is going down
9.3. Line Chart
Third chart type is line chart which shows one line. There is not body or bar that gives you information about open, close, high and low price of trading pair.
This chart is less valuable to me than previous two I have described above. Line chart does not give me important information about time frame and price behavior.
Line chart gives good information about trend and that is all.

On the image above I have pointed how it is not possible to determine what is monthly high/low/open or close price. I have used same time of the price like on the two previous chart type and you can see that is worthless to compare them.
If you follow me in further reading you should use candlestick chart type. If you use bar chart it is fine and you will be able to follow me. But for easier following change colors of bull and bear bar on bar chart type.
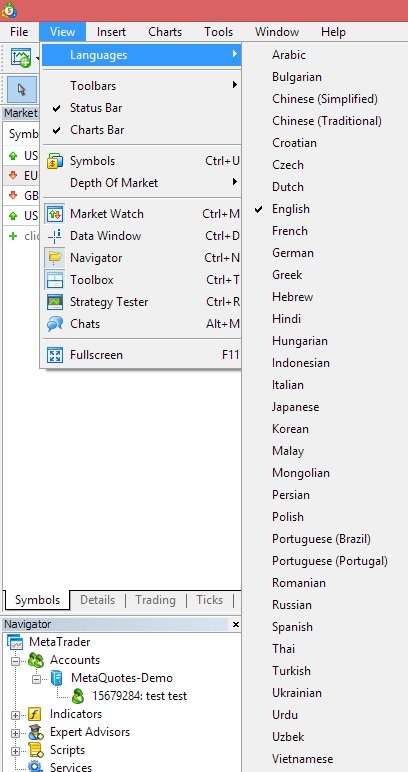
10. How to Set the Language in Metatrader 4
If you do not get around with English language you can change it to another one if it is supported by Metatrader 4 installation package.
You need to check that by selecting menu “View” and under “Languages” section you will see a list of all available languages.
If you find the language you would like to have on the Metatrader 4 trading platform just click on it.
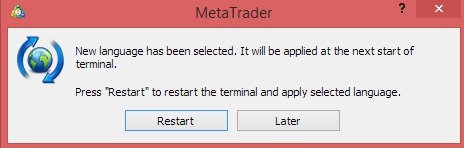
When you click on it you will get new window message that says you need to restart Metatrader 4 trading platform in order to change language.
When you restart Metatrader 4 trading platform you will have all on the platform in new language.
You can try it and return to English if you do not like to have another language.
Conclusion
Now you are ready to start trading in Forex. You are equipped with Metatrader 4 trading platform, Account and Charts.
In the next chapter I will show you how to open order and everything you need to know about orders.
Before you continue to the next step take your time and share this post to your friends who also seeks for help how to start on Forex trading as beginner. Help them as you would like that some one helps you.

0 Comments